|
|
Graphing a voltmeter on an SRMS board.
##NOTE MRTG is kind of old and does not handle negative numbers or decimals. MRTG2 / RRDTOOL is reccommended
Install and test MRTG. When MRTG is confirmed to work.
Add this code to your mrtg.cfg file to monitor voltmeter #8:
----------------
Target[rmsv2-vm8]: 1.3.6.1.4.1.21749.3.1.2.56.8&1.3.6.1.4.1.21749.3.1.2.56.8:public@64.141.73.254
MaxBytes[rmsv2-vm8]: 60000
PageTop[rmsv2-vm8]: Example 60v voltmeter graphing with 3 decimal place accuracy. Graphing is done in millivolts.
Title[rmsv2-vm8]: MOUNTAIN BATTERY MONITOR 24 Volt System
PNGTitle[rmsv2-vm8]: RMSV2 Voltmeter #8
Unscaled[rmsv2-vm8]: dwmy
WithPeak[rmsv2-vm8]: dwmy
Options[rmsv2-vm8]: absolute, gauge, integer, nopercent, nolegend
YLegend[rmsv2-vm8]: Milli Volts
ShortLegend[rmsv2-vm8]: mv
LegendI[rmsv2-vm8]: Millivolts:
LegendO[rmsv2-vm8]:
TimeStrPos[rmsv2-vm8]: RU
---------------

Done/Easy

Explanation of the first line:

Target[rmsv2-vm8]: 1.3.6.1.4.1.21749.3.1.2.56.8&1.3.6.1.4.1.21749.3.1.2.56.8:public@64.141.73.254

The first part is the OID of the voltmeters in millivolts. Follow this guide to get the OID for a voltmeter:
Voltmeter Millivolt OIDs Start with '1.3.6.1.4.1.21749.3.1.2.56.' and add
1 for voltmeter #1
2 for voltmeter #2
3 for voltmeter #3
4 for voltmeter #4
5 for voltmeter #5
6 for voltmeter #6
7 for voltmeter #7
8 for voltmeter #8
In our example, we used voltmeter #8. Our OID was then 1.3.6.1.4.1.21749.3.1.2.56.8
Once you have the OID you must add an '&' and put the same OID in again.
After the first ":" you put the snmp read only community password followed by an '@' then the ip or
hostname of the SRMS Board. The snmp read only community password is set in the setup area of the SRMS web interface.
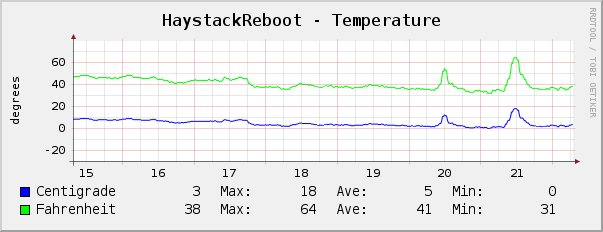
Graphing the temperature.
---------------
Target[rmsv2-temp]: 1.3.6.1.4.1.21749.3.1.2.5&1.3.6.1.4.1.21749.3.1.2.6:public@64.141.73.254
MaxBytes[rmsv2-temp]: 150
PageTop[rmsv2-temp]: Example SRMS temperature graphing.
Title[rmsv2-temp]: MOUNTAIN BATTERY MONITOR System Temperature
PNGTitle[rmsv2-temp]: RMSV2 System Temperature
#Unscaled[rmsv2-temp]: dwmy
#WithPeak[rmsv2-temp]: dwmy
Options[rmsv2-temp]: absolute, gauge, integer, nopercent, nolegend
YLegend[rmsv2-temp]: Degrees
ShortLegend[rmsv2-temp]:
LegendI[rmsv2-temp]: Celcius
LegendO[rmsv2-temp]: Farenheight
TimeStrPos[rmsv2-temp]: RU
---------------

Explanation of the first line:

Target[rmsv2-temp]: 1.3.6.1.4.1.21749.3.1.2.5&1.3.6.1.4.1.21749.3.1.2.6:public@64.141.73.254
Notice this time we used the OID for Celcius first then the OID for Fahrenheit. This puts both readings in one graph.
Graphing amperage.
Target[rmsv2-vm3]: 1.3.6.1.4.1.21749.3.1.2.54.3&1.3.6.1.4.1.21749.3.1.2.54.3:public@64.141.73.254
MaxBytes[rmsv2-vm3]: 100000
PageTop[rmsv2-vm3]: Example amp meter graphing with 3 decimal place accuracy.\nGraphing is done in milliamps.
Title[rmsv2-vm3]: RMS Demo Unit Input Amperage Monitor
PNGTitle[rmsv2-vm3]: RMSV2 Voltmeter #3
#Unscaled[rmsv2-vm3]: dwmy
#WithPeak[rmsv2-vm3]: dwmy
Options[rmsv2-vm3]: absolute, gauge, integer, nopercent, nolegend
YLegend[rmsv2-vm3]: Amps
ShortLegend[rmsv2-vm3]: ma
LegendI[rmsv2-vm3]: Amps:
LegendO[rmsv2-vm3]:
TimeStrPos[rmsv2-vm3]: RU

Explanation of the first line:

Target[rmsv2-vm8]: 1.3.6.1.4.1.21749.3.1.2.54.3&1.3.6.1.4.1.21749.3.1.2.54.3:public@64.141.73.254

The first part is the OID of the ampmeter in milliamps. Follow this guide to get the OID for a ampmeter:
Ampmeter Milliamp OIDs Start with '1.3.6.1.4.1.21749.3.1.2.54.' and add
1 for voltmeter #1
2 for voltmeter #2
3 for voltmeter #3
4 for voltmeter #4
5 for voltmeter #5
6 for voltmeter #6
7 for voltmeter #7
8 for voltmeter #8
In our example, we used voltmeter #3 and activated amp meter mode as a
100 amp / 100 millivolt current shunt to monitor generator output from a water wheel.
Our OID was then 1.3.6.1.4.1.21749.3.1.2.54.3
Once you have the OID you must add an '&' and put the same OID in again.
After the first ":" you put the snmp read only community password followed by an '@' then the ip or
hostname of the SRMS Board. The snmp read only community password is set in the setup area of the SRMS web interface.
Other graphing programs.
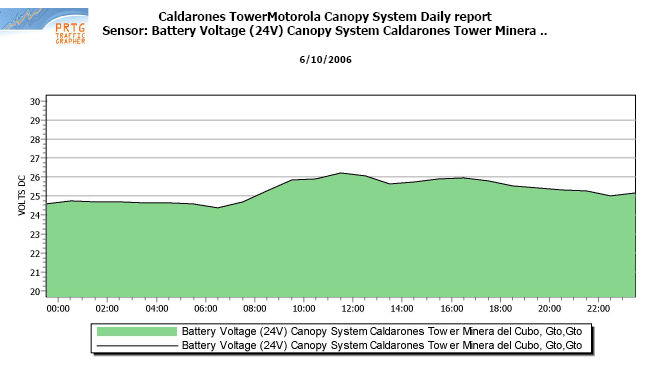
Below is a screen shot of a graph made with PRTG. The graph depicts battery voltage at a mining site in Mexico.
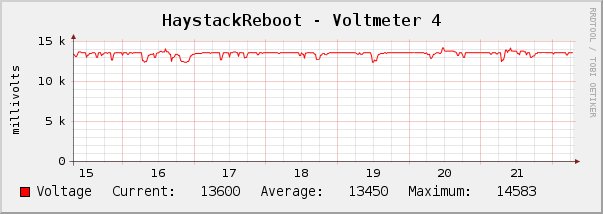
Below are screen shots of graphs made with CACTI. The graphs depict temperature and battery voltage.