Built in graphs with data retention of 10 years!
No Need for an external monitoring server.
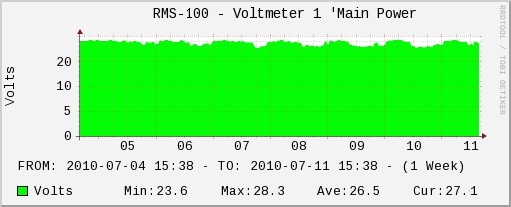
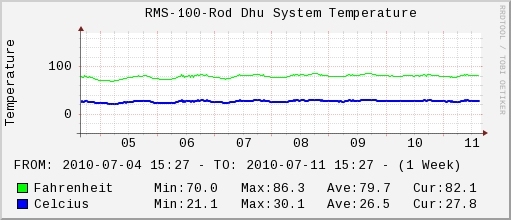
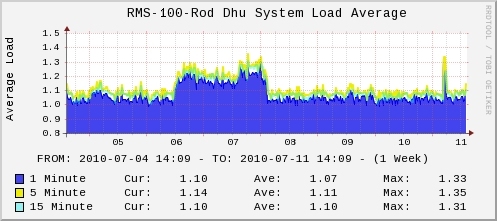
The graphs below are created by the RMS-300 board using RRD tool. Graphs are available for
each voltmeter , temperature, and system load.
Day, Week, Month, Year, 5 Year and 10 Year graphs are available.
Other Graph Programs
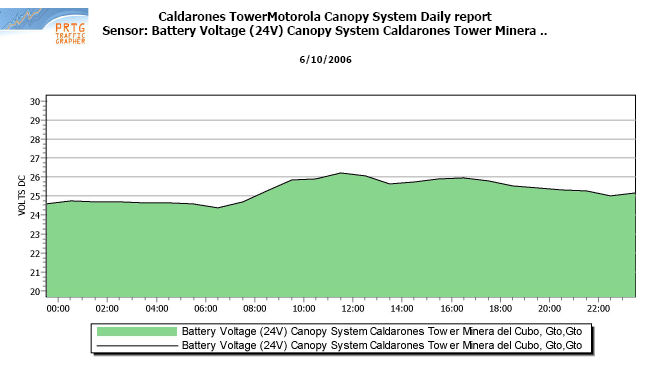
Below is a screen shot of a graph made with PRTG. The voltmeter graph depicts battery voltage at a
mining site in Mexico.
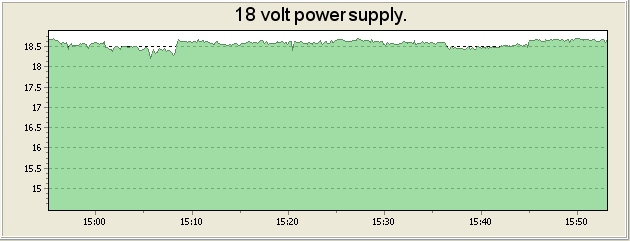
Below is another screen shot of a graph made with PRTG. The voltmeter graph depicts an 18 volt power
supply.
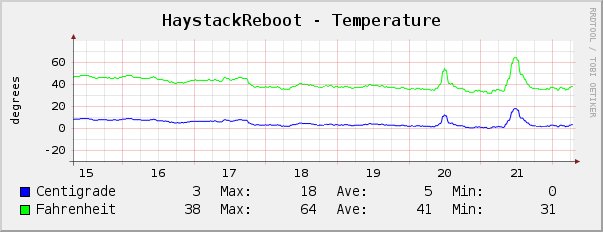
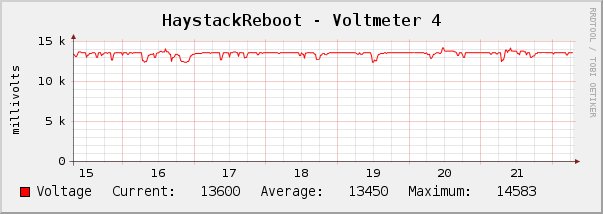
Below are screen shots of graphs made with CACTI. The
graphs depict temperature and battery voltage.
Our Story
EtherTek Circuits started its business in 2001. Ever since we have provided remote monitoring and control solutions for Remote Tower Sites, the Oil & Gas industry, Telemetry systems for Agriculture, Municipalities, Mines, Solar Farms, Hydro Plants, and the Military.


